09 / INFORMATION DESIGN & DATA VISUALIZATION
FIELD
NOTES.
A personal information-design study exploring how abstract data can become clear visual relationships through scale, rhythm and hierarchy.
01 / VISUAL LANGUAGE
Make data visible.
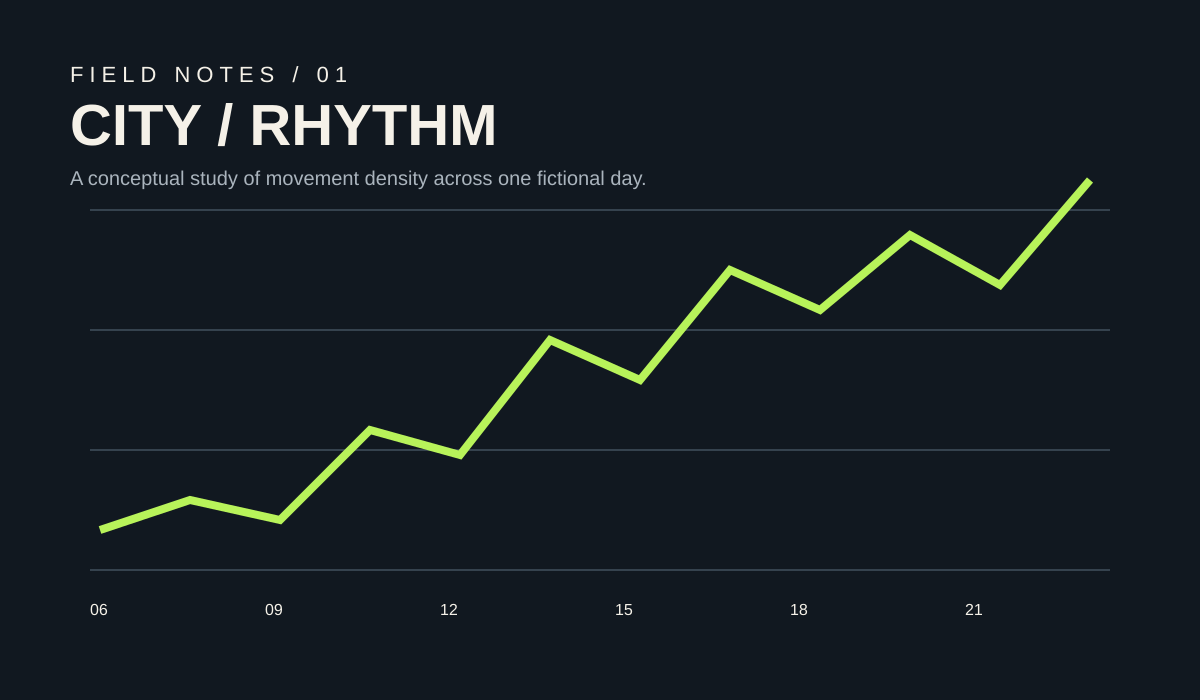
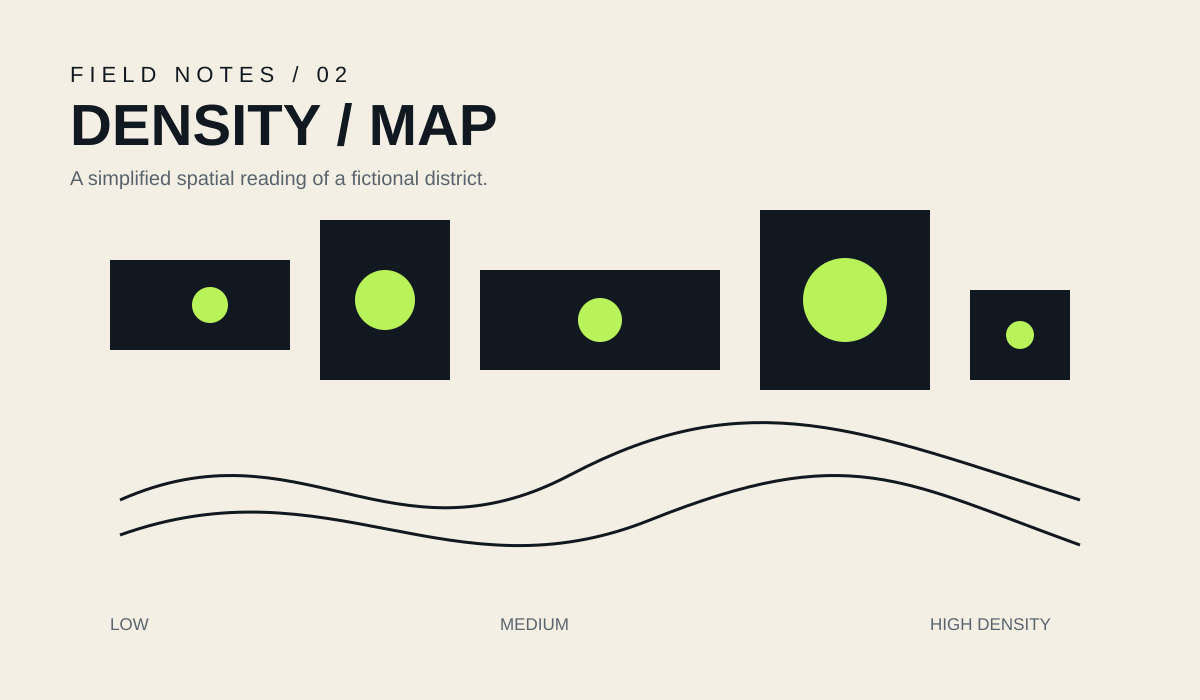
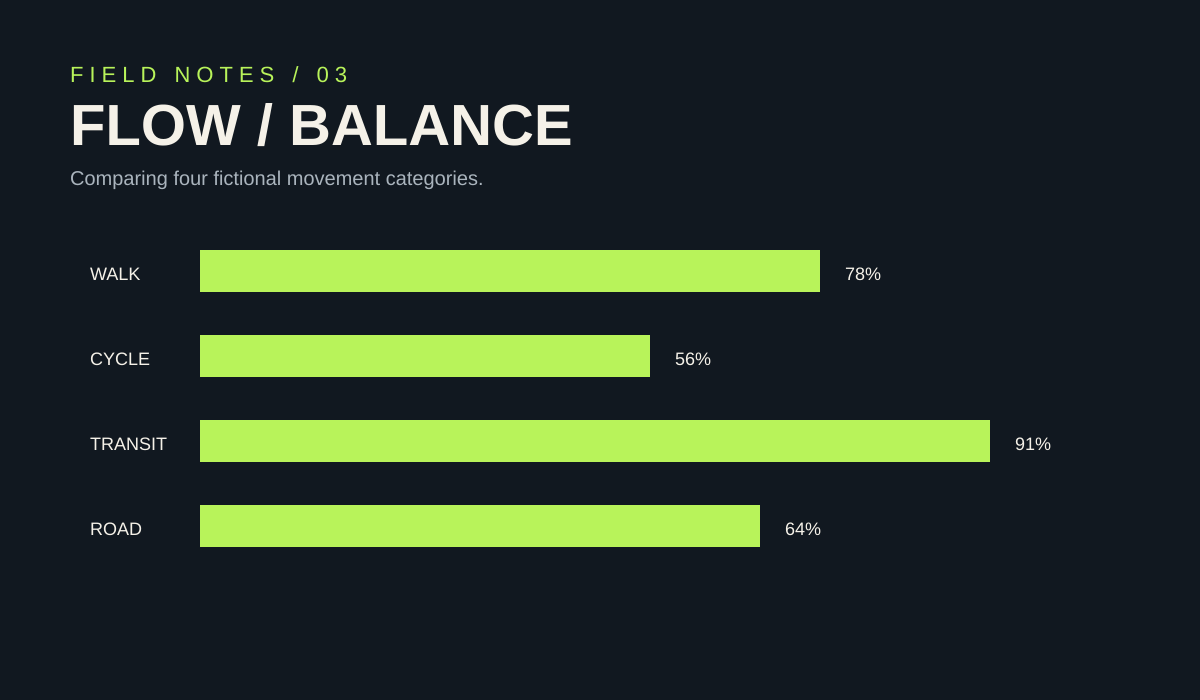
The system uses a restrained graphic vocabulary: proportion for quantity, position for relationships, repetition for rhythm and contrast for emphasis. All values shown are fictional and created for this conceptual study.
02 / SYSTEM
One language.
Many readings.
03 / PRINCIPLES
Designed to be read.
01 / SCALE
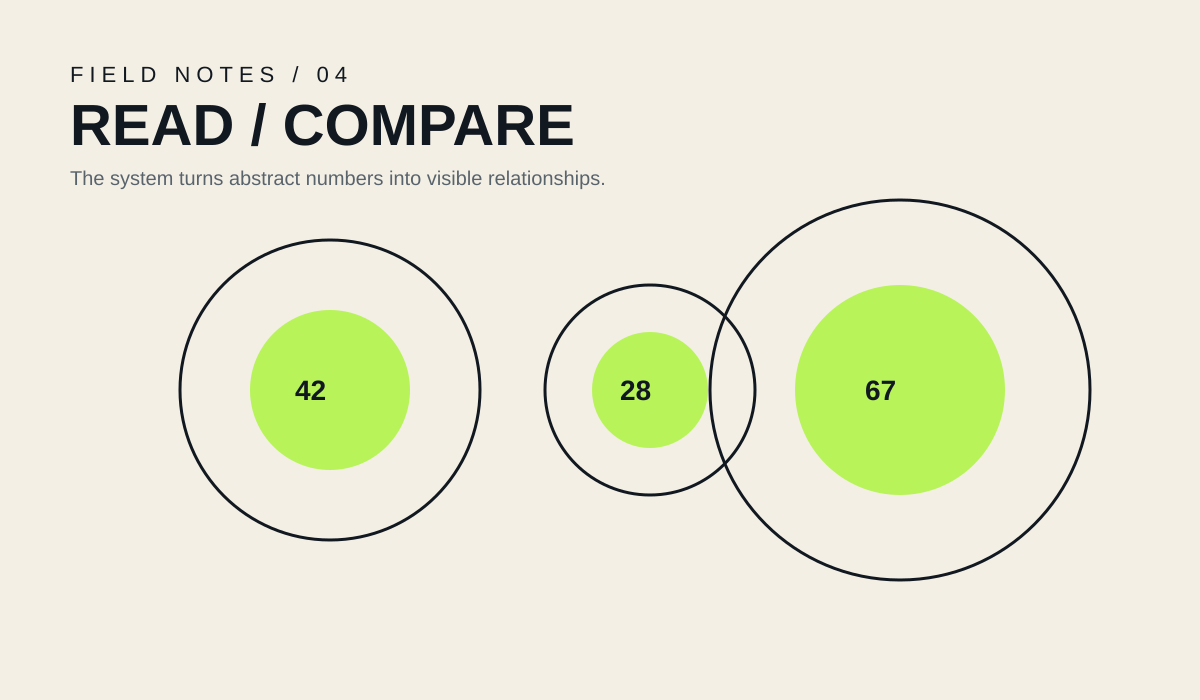
More becomes larger.
Quantity is expressed through controlled size relationships rather than decorative effects.
02 / POSITION
Place creates context.
Spatial relationships help the viewer understand how values connect and differ.
03 / CONTRAST
Emphasis stays useful.
A single accent value directs attention without overwhelming the information.